Hello fellow traders.
As our members know, we’ve been long in Bitcoin. The crypto has made a solid rally toward new all-time highs, gaining more than 20% since our entry on the June 22nd. In this technical article, we are going to present short term Elliott Wave forecast of BTCUSD. The crypto shows impulsive bullish structure in the cycle from the 105,141 low, calling for a further strength. In the following text, we will explain the analysis in more detail and present the potential target levels.
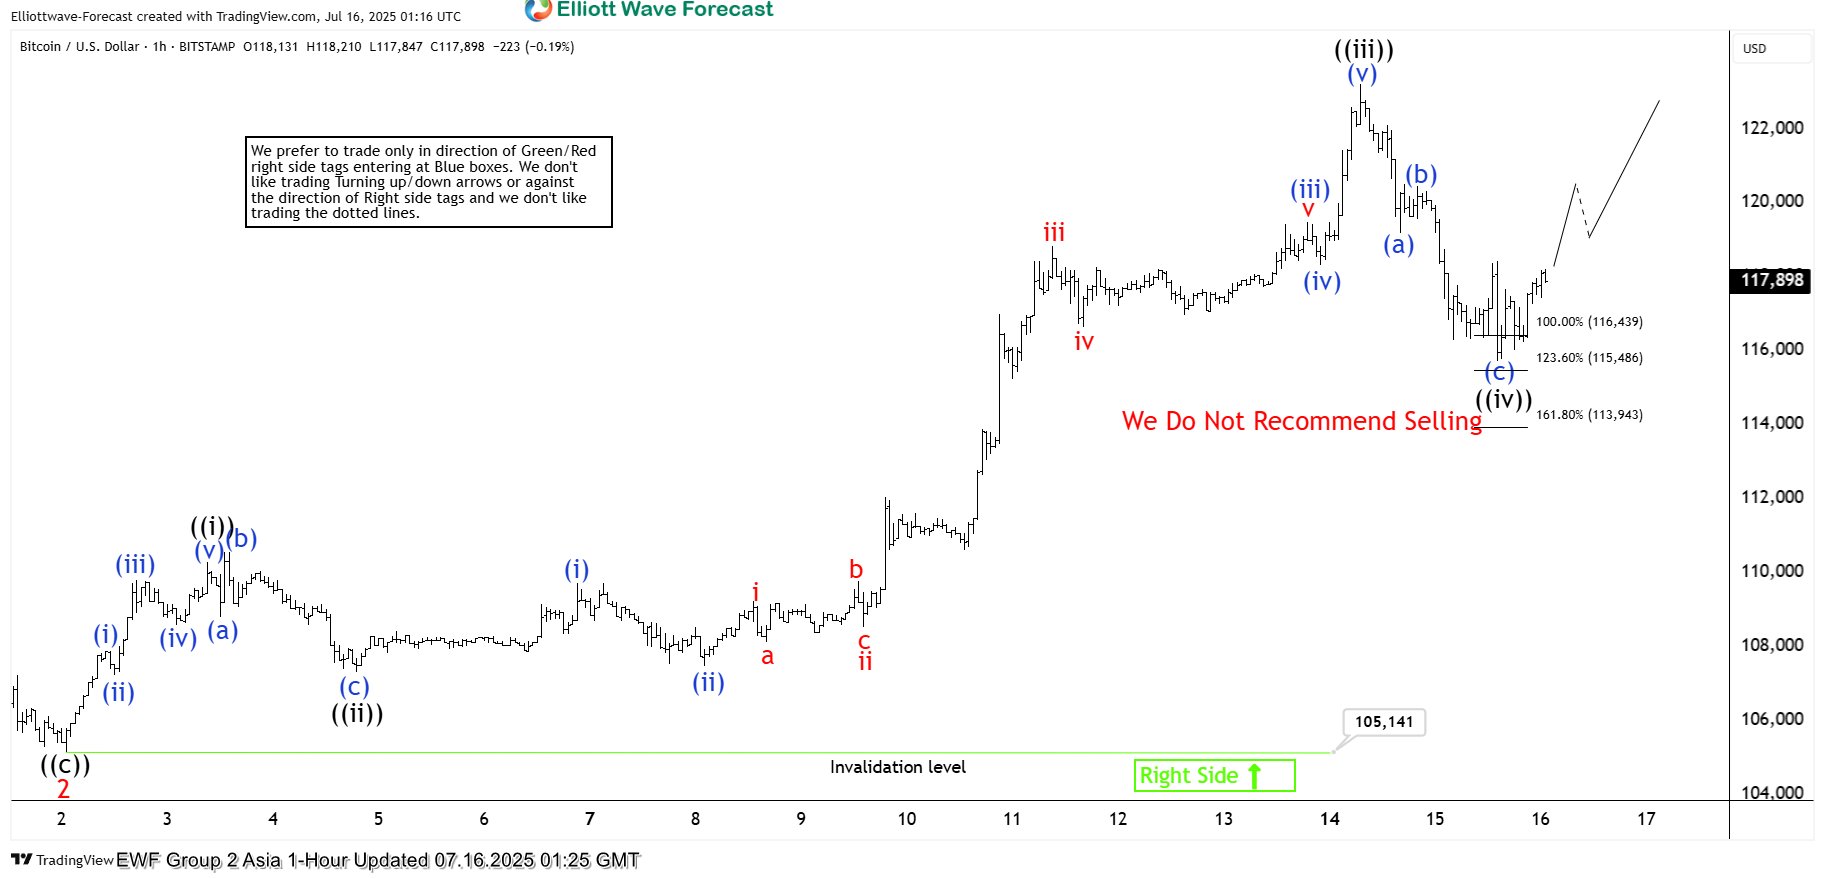
BTCUSD Elliott Wave 1 Hour Asia Chart 07.16.2025
The cycle from the 105,141 low appears to be unfolding as a 5-wave pattern. BTCUSD has completed a clear 3-wave pullback, which we label as wave ((iv)). The price has reached the equal legs area at 116,439–115,486 and is already showing a reaction from that zone.
We do not recommend shorting at this stage and continue to favor the long side. Ideally, we’d like to see further separation from the recent low to confirm that the next leg higher is in progress.
90% of traders fail because they don’t understand market patterns. Are you in the top 10%? Test yourself with this advanced Elliott Wave Test
Official trading strategy on How to trade 3, 7, or 11 swing and equal leg is explained in details in Educational Video, available for members viewing inside the membership area.
BTCUSD Elliott Wave 1 Hour London Chart 07.16.2025
Bitcoing keeps progressing higher from the equal legs area. While above 115,826 low, Elliott Wave count suggests BTCUSD is have wave ((v)) is in progress, targeting 125,014-127,884 area next.
Reminder for members: Please keep in mind that the market is dynamic, and the presented view may have changed in the meantime. Our chat rooms in the membership area are available 24 hours a day, providing expert insights on market trends and Elliott Wave analysis. Don’t hesitate to reach out with any questions about the market, Elliott Wave patterns, or technical analysis. We’re here to help.


